Sales By Customers Dashboard
Data visualization is all about answering questions. Business grows and you already know how your sales by products go. Better understanding of who and how actually buys your products can help with creating customer profile, recognizing customer’s needs and with preparing marketing operations.
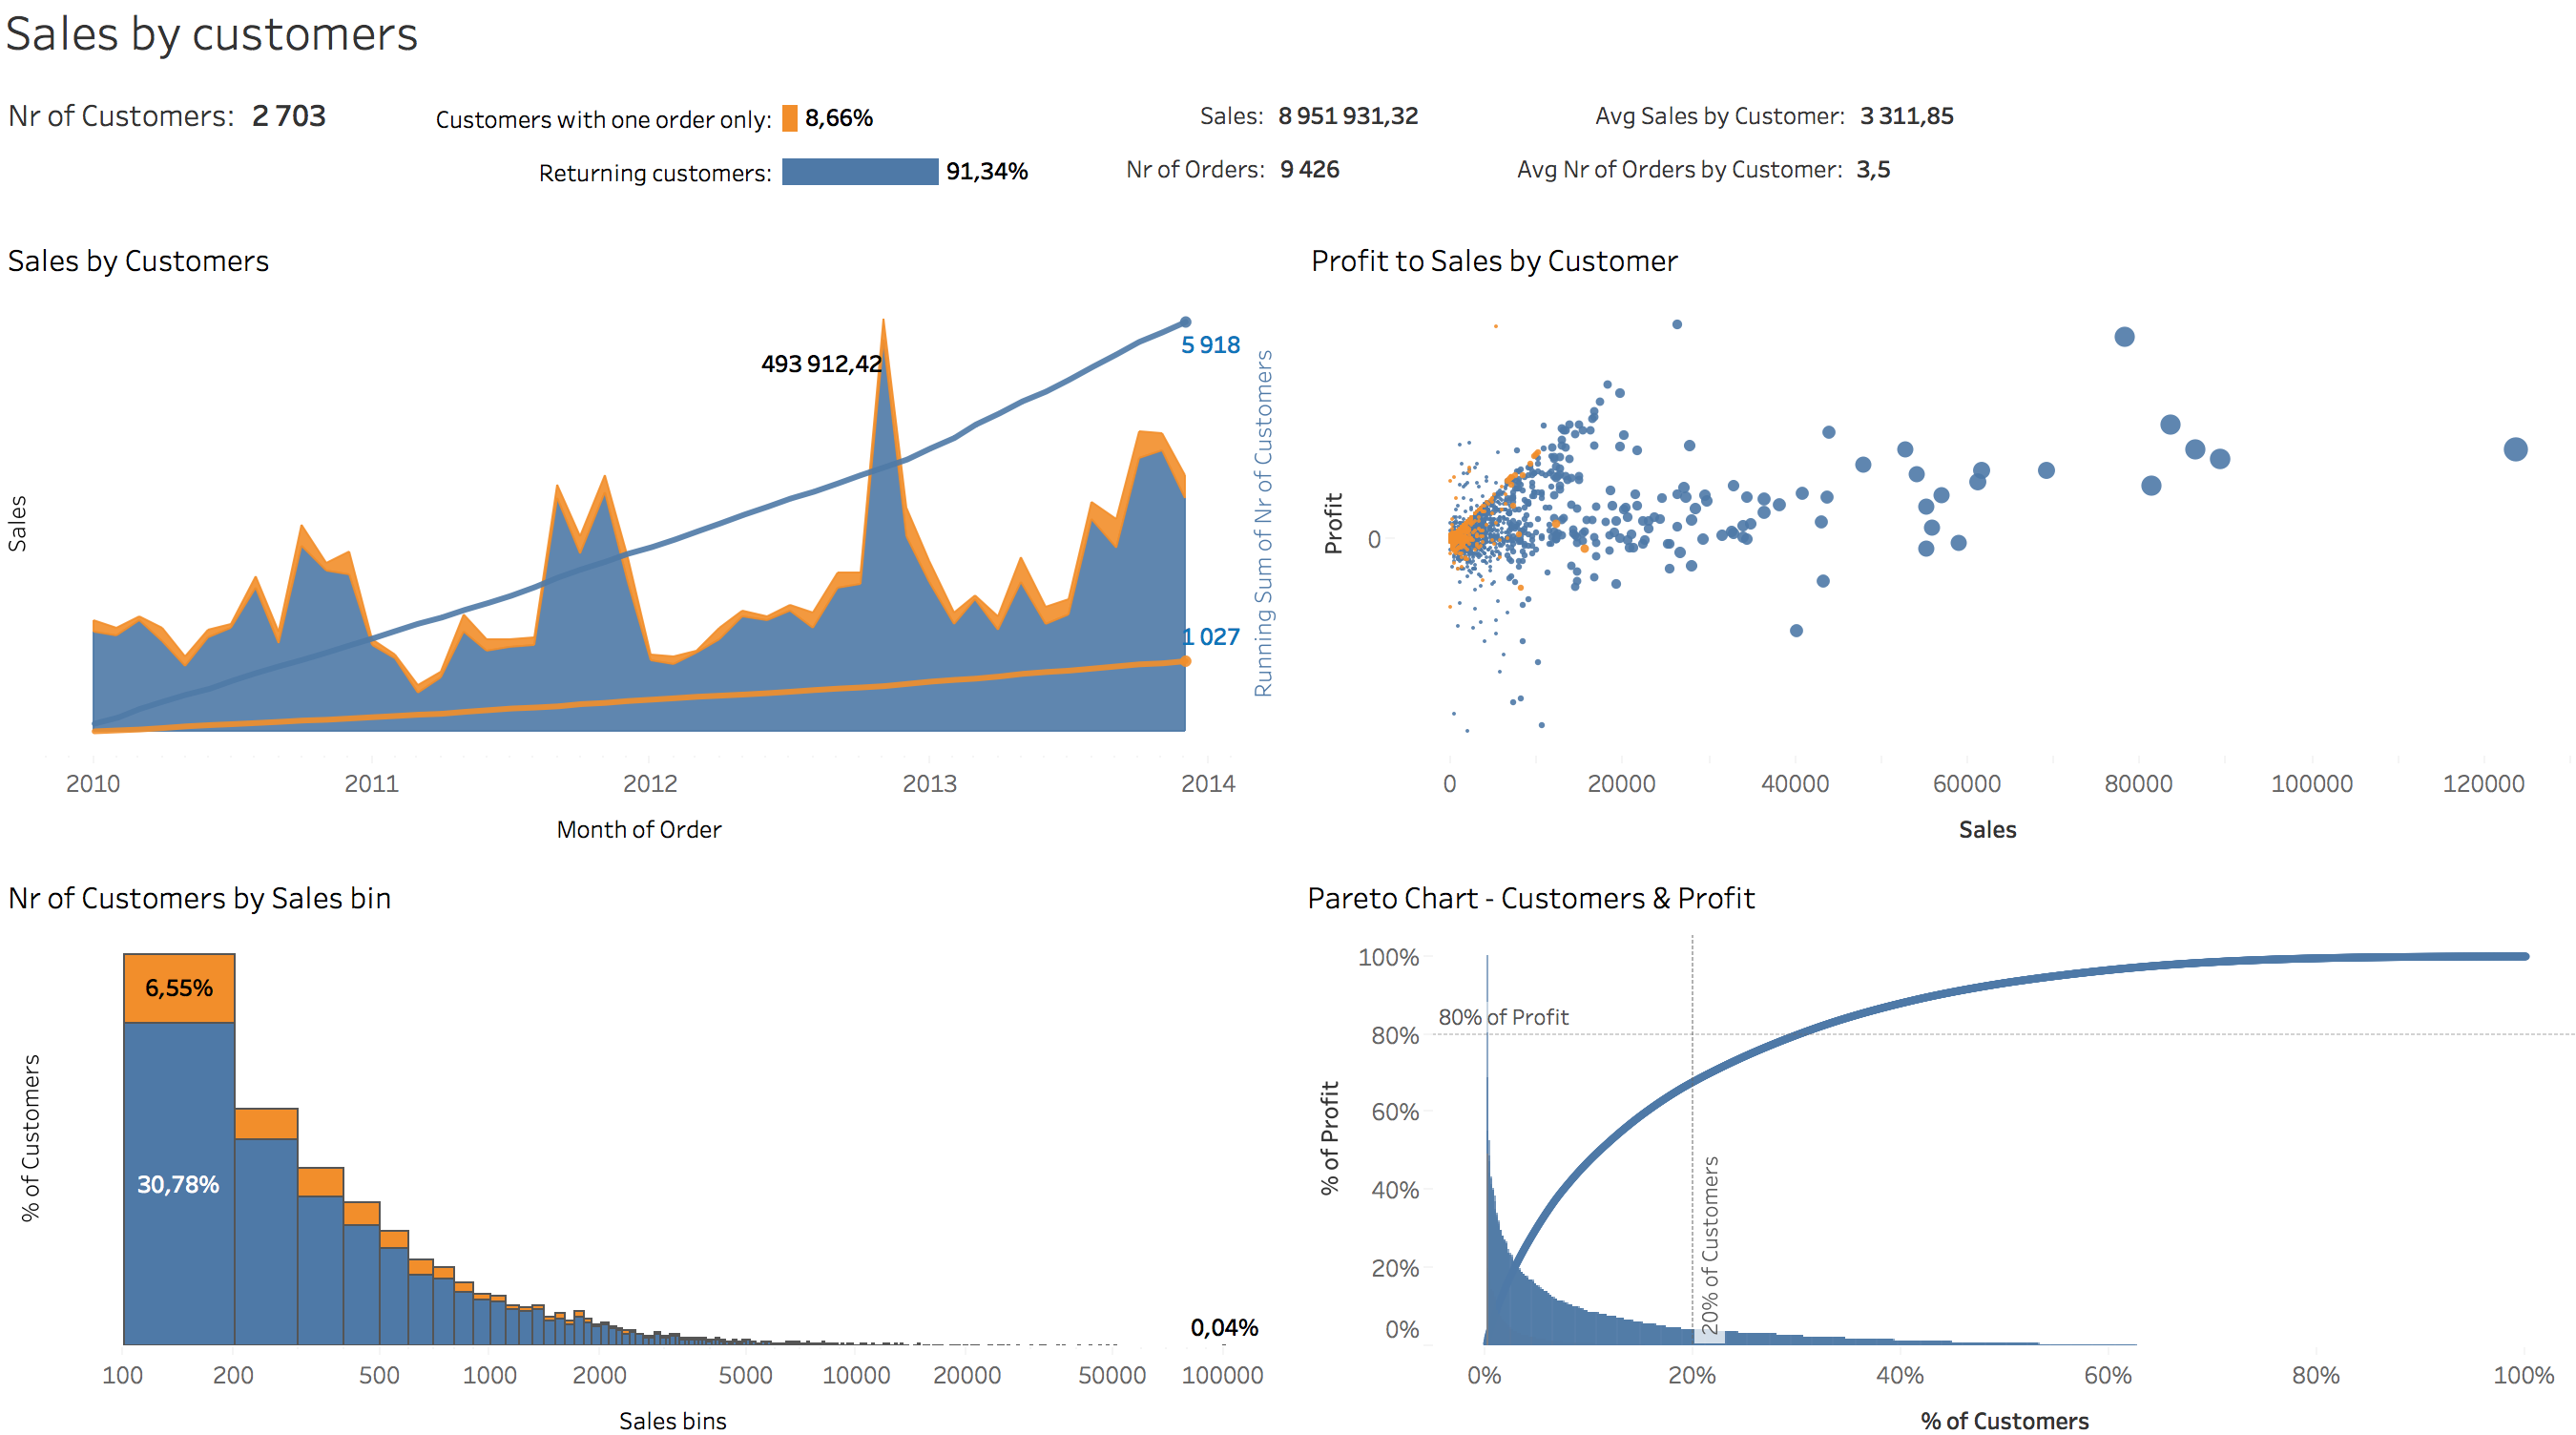
What the average order of our customer looks like?
According to data from last few years, our average customer makes orders 3-4 times a year, everytime ordering products worth in average 3311,85. Over 91% of customers return for next purchases which is a great result. So far our business has served 2703 customers for the amount of almost 9M.

What is the trend of sales?
Every year we can notice the repeating trend. First quarter starts quietly and somewhere in the middle of summer there is a noticeable increase is sales which strikes up at the end of year. We should focus on that and try to recognize what repeatable situations encourage or force our customers to purchase in those seasons.
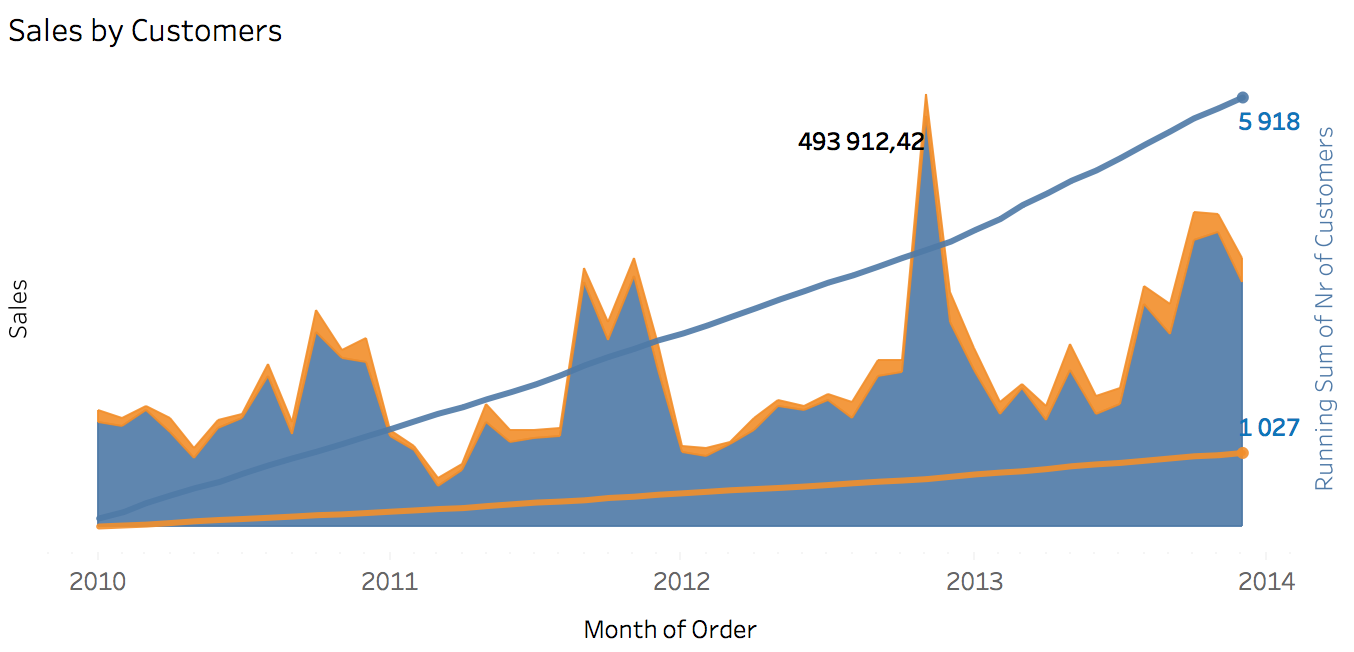
One more interesting thing here is that the increase of new and returning customers is very stable. We can see that during the whole year number of customers with one order only and regular customers increase constantly with no particular spikes.
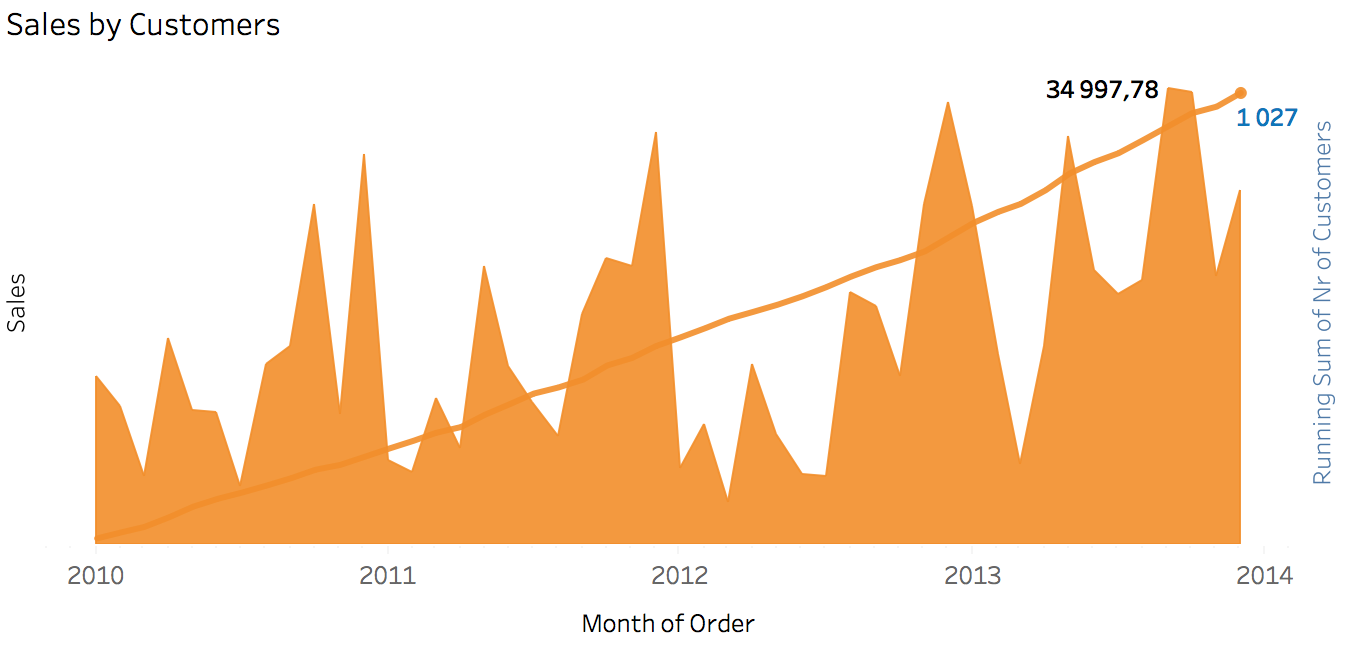
What is the difference between customers with one order only and returning customers?
Despite the fact that over 91% of sales are generated by returning customers, 1027 of 2703 are those with one order only. It makes 38%! Their trend is similar to what we have discovered for the whole population, so we can assume, that one third of our everyday customers are people who make their purchases occasionally which gives us a great opportunity to encourage them to return by developing marketing operations.
How much our customer usually spend on purchasing?
We can see that 37% (30,78+6,55) of customers spend not more than 100 per 1 order. Next 22% (19,72+2,81) spend not more than 200. So 50% of all customers make usual purchases in less than 200.
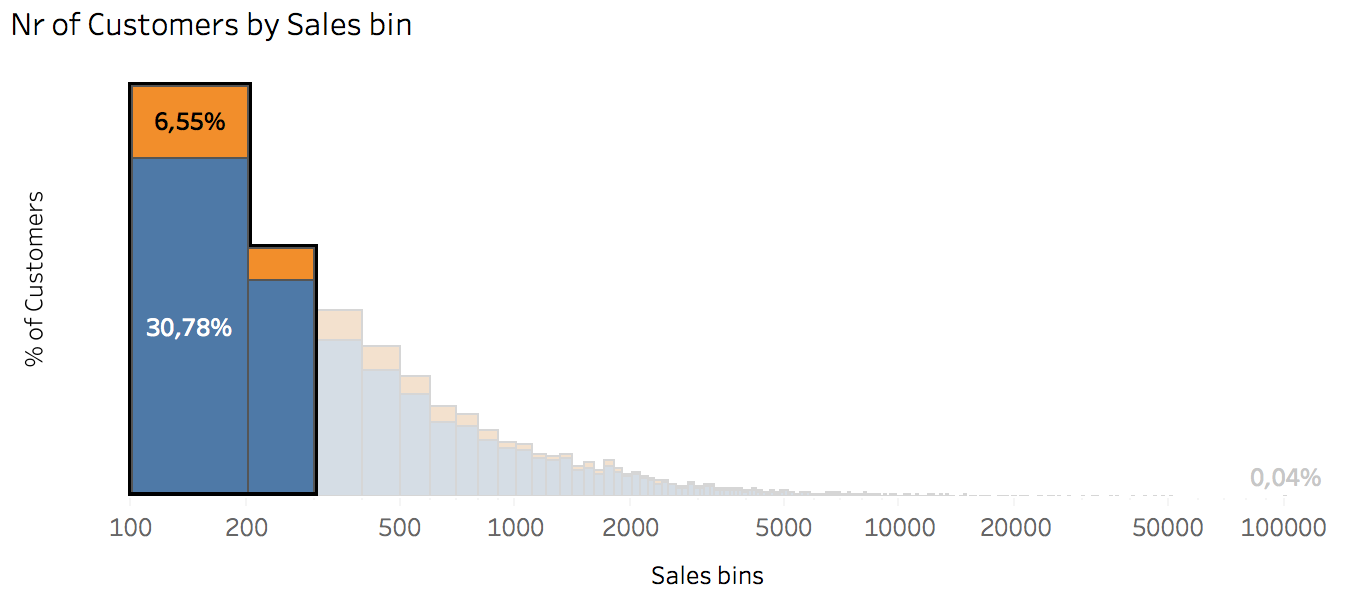
Analysing year after year, these sales bins looks pretty stable, so we can assume that this regular tendency.

But how the profit to sales by customer looks like?
It confirms that the biggest cluster of customers make orders worth between 0 and 200. But what is surprising – even with so good sales at least 1200 customers generated negative profit! The company should definitely check margins on products and their discounts.

Then who actually generates profit?
To answer that question let’s use Pareto Chart, which in our case we can use to compare % of customers to % of profit.
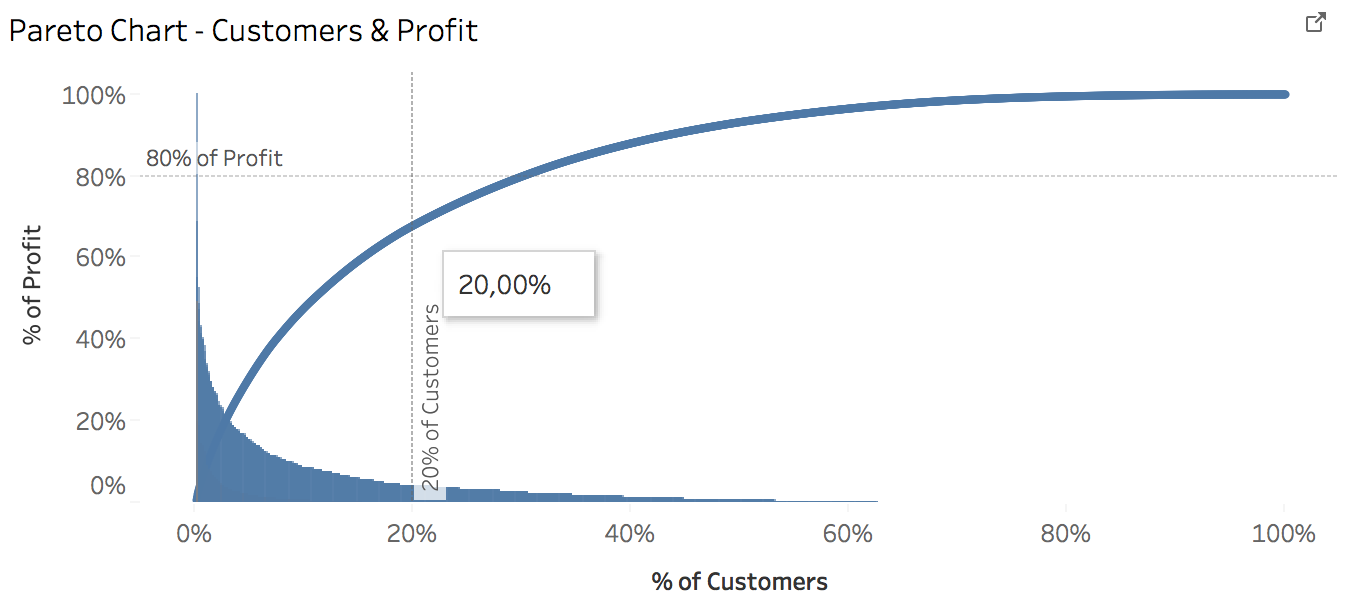
So in total the situation is not so bad, as we discovered in previous question. Still, 20% of our customers generate about 70% of profit. It’s not the ideal Pareto 80/20 principle, so let’s try to find it somewhere else 🙂
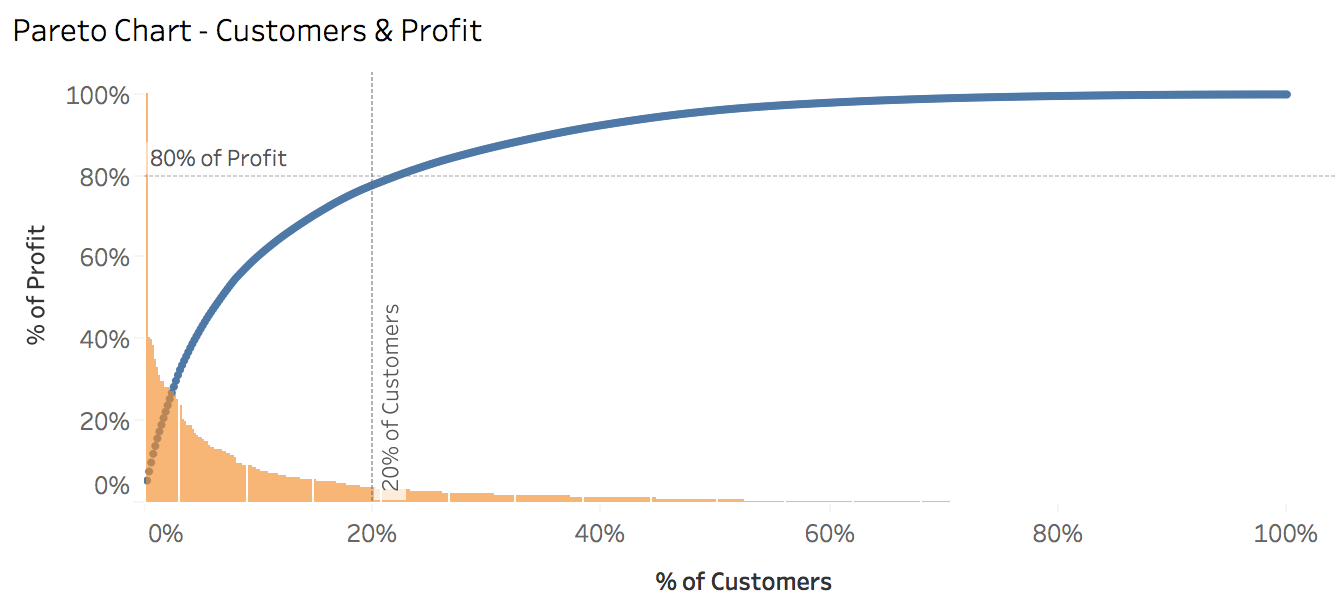
What is the customer to profit distribution for those who have one order only?
It’s interesting that almost exactly 80% of profit is generated by 20% of customers but only for those who are our occasional clients.
OK! Now we know a lot more about sales by customers. General questions are answered. Of course this is just a beggining of your journey. Knowing all of this generates next questions in your mind and this is fantastic! You know how to quickly answer your business questions, so write them down and design new metrics and visualizations which will answer them easly. Or maybe you already have some new questions? Put them in post comment so we can discuss them further! Thanks!
Here is link to dynamic version of Sales by customers dashboard.