KPIs Review Dashboard
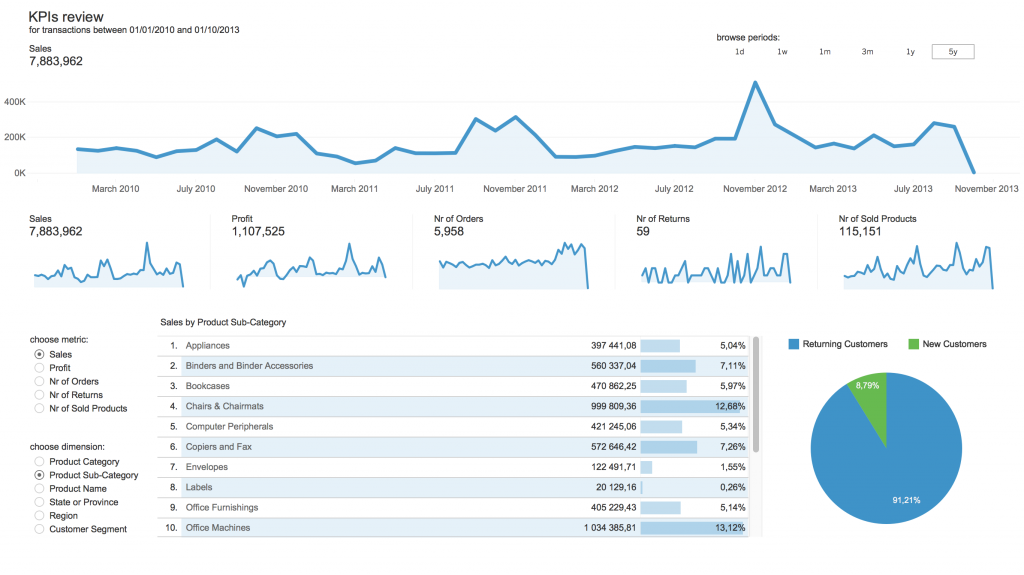
Whenever it’s possible I prefer creating one-dashboard-only Business Intelligence applications. But how can I fit all visualizations for so many KPIs on one screen? Here is the solution.

Dynamic version of KPI dashboard in Tableau Gallery is here.
One general dashboard with dynamic measures and dimensions.
Most of business KPIs are analysed on trend chart and this one comes as main viz on the dashboard. Usually it takes a lot of space due to higher resolution needs for further investigations, but pasting many similar objects like this for each KPI is not quite efficient. Instead of creating dedicated visualization for every measure per dimension comparison I would suggest to use dynamic fields with possibility to change your displayed metrics with filters-like selections.
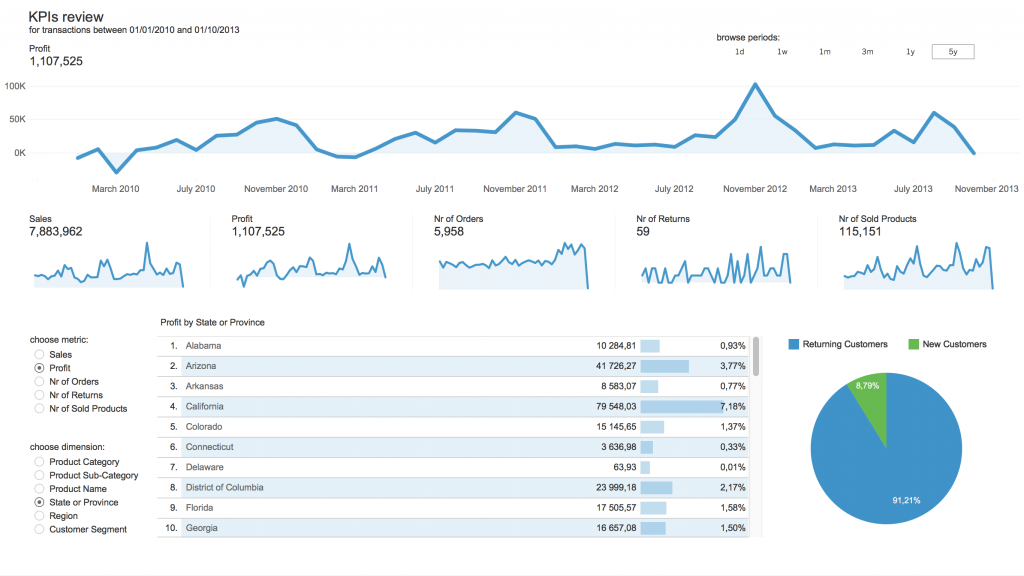
By default my dashboard shows “Sales” on main line chart and “Sales by Product Sub-Category” on the table bellow. Let’s choose “Profit” as measure and “State or Province” for dimension.

Notice that main chart shows now the trend of Profit and also KPI shows total Profit value. Also measure and dimension details are shown on the table with proper title – “Profit by State or Province”.
Having huge line chart here let’s check two more useful features in one-dashboard KPI review.
Period browser and date drill-down option.
It’s good to have defined time filters for analysing the most interesting periods in business data. Periods like: 1 day, 1 week, 1 month, 3 months, 1 year, 5 years back from today are mostly used to check KPI’s trend and easy to implement by button filter like we’ve got here.
The question might be: What is the trend of Sales for last 3 months with daily details?
Just click “3m” button and drill down on date hierarchy (available in this case on hover) to see daily values.

All right. I hope this dashboard sample was useful for your next app design related with answering business questions. If you have other ideas how to avoid clutter and implement minimalistic&essentialistic dashboard – please share it in comments.
