Age Pyramid Prediction In Poland
What our community will look like in next 30-40 years? Who will be working for our retirement? What is the future of Polish society? Let’s try to answer those questions with some data analysis using age pyramid visualization.
What official statistics say and what does it mean?
Polish government has a great data regarding historical and current community statistics. A lot of them are available on stat.gov.pl and my analysis also uses their shared data, so prediction which I visualize here is based on an official information. How it looks like for today?

In 2019 there are almost 38M citizens in Poland. The average age is 41. If we assume that the production age is between 18 and 65, then 18% of people is in “before-production” age (blue), 63,8% in “production” age (grey), and only 18,4% are in “post-production” age (yellow) where most of them are retired. In 2019 for 1 person on retirement there is still 3,45 working people (officialy unemployment is 3,7% today). And I am exactly right here:
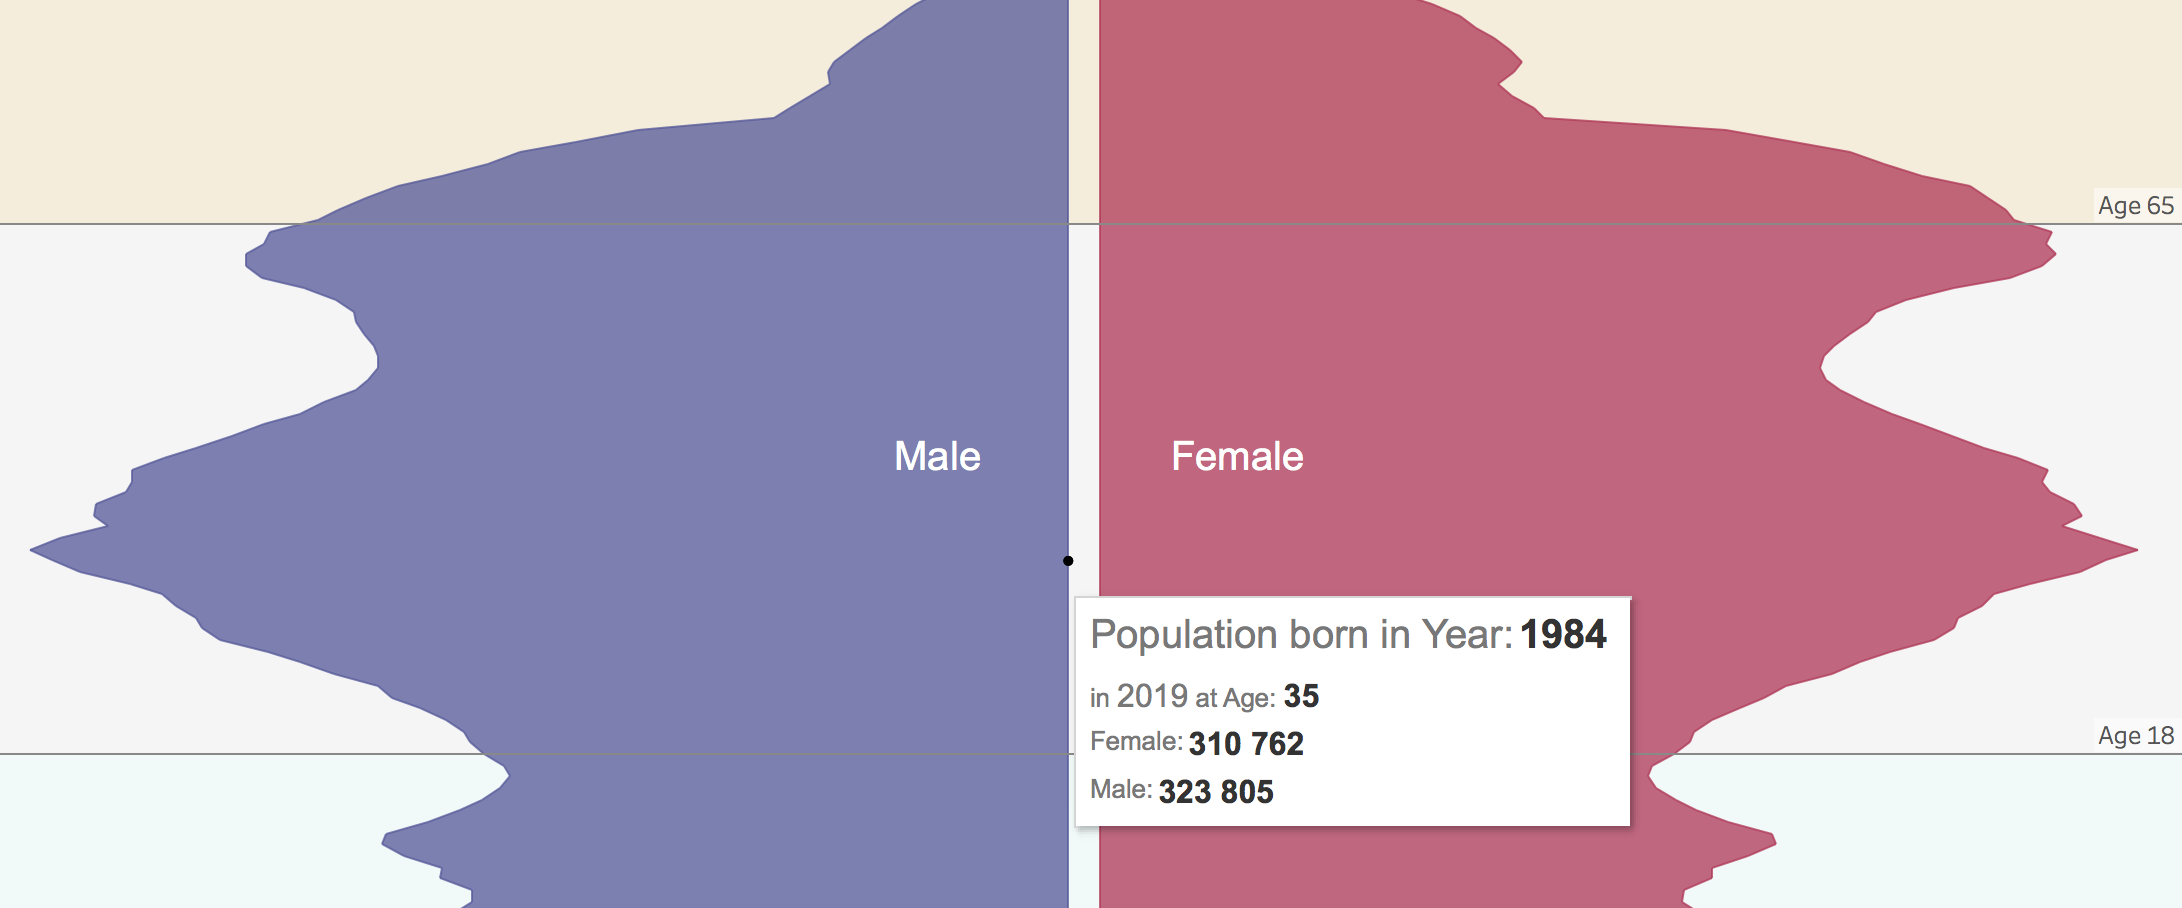
Born in 1984, in 2019 at age 35 I represent the second and only so far so huge demographic boom. Since then number of births only decreases with small peak around year 2008. I am a little bit concerned about this fact…
Will there be anyone to work for my retirement?
Let’s check what an official prediction says:

Data model says that in 2050 the statistical citizen will live longer, so more people will be on retirement. Also number of births will continue to decrease which in result gives less then 35M of population and the average age will increase to about 48. Are we going to live in an old society? And the most important metric for me – What is the “post-production” to “production” ratio? In 2050 for one person on retirement there will be only 1,68 working people! Just to remind – in 2019 it is 1 : 3,45. The pension system is facing a big challenge…
Use analysis to answer your questions and understand the future.
It is obvious that future in next 30-40 years will be a lot different than it is now in Poland. Changes in pension system, encouraging people to save for retirement and opening borders to young immigrants are probably the most likely scenarios.
If you have found another insights – please let me know in comments.
The link to full dynamic age pyramid visualization is here.